November 6, 2022
Our gold bond spread chart has a trendline at 160 as well. It almost matches one you see on our blog page. GLD may need to move above 160 to see a sustained rally.

November 6, 2022
Our gold bond spread chart has a trendline at 160 as well. It almost matches one you see on our blog page. GLD may need to move above 160 to see a sustained rally.

KEEP FOLLOWING THE NEWS, EARNINGS, FED, AND YOUR GUT, IF YOU WANT KEEP LOSING MONEY |
As a trader and investor looking to pull money out of the market regularly, the only thing you are really looking for is the price of the investment you bought or sold-short to move in your favor. So, common sense tells us that “Only Price Pays,” not news, not how much we love a stock or commodity. If the price does not move, you do not make any money, period.
If you think it’s going to help you become a better trader by reading financial articles, watching the business channel, listening to other people’s opinions, or the Fed, then you are sadly mistaken. That is the absolute best way to undermine all your hard work, analysis, and hard-earned money. The last thing you want to be doing is second-guessing yourself each time you are placing a trade or adjusting an open position.
Remember that most news and surprise news events follow the direction of the trend even if the news is against the trend; more times than not, the price action will be nothing more than an intraday or a couple-day blip on the chart. So, the news, rumors, opinions, and tips that are causing you FOMO can be eliminated if you become a Technical Trader. Imagine if you could start enjoying investing again, owning only assets that are rising in value, and knowing when to exit positions not moving higher. Wouldn’t that be nice?
I wrote a really fun and unique article about knowing your personality type, and how that will affect your trading and investing results. And guess what, 73.3% of individuals do not have the personality to become a successful trader or investor long term. The article is called A Valuable Lession In Knowing Investors And Your Own Personality Type.
This is the wisest investment advice I have read out of the hundreds or thousands of newsletters I have read.
Technical Trader Follower Comment
I know so many individuals who are not happy with their investment performance. Either because of their trading results or what their advisor has not done to protect their wealth and retirement accounts. I speak to individual investors daily on the phone and hear horror stories, which makes me feel sick.
When these investors learn how bear market losses could have been avoided, and profited from with conservative and slow strategy, they have an AHA moment. Once they see how technical analysis and position and risk management can more than double their annual returns and cut their max drawdowns (losses) from 52% down to only 6% they start to get excited again.
Imagine cutting your retirement account volatility by over 88%. Would you sleep better at night? Would it save you difficult conversations with your spouse? Would it allow you to retire without the fear of running out of money?
Well, now you can rid the stock market rollercoaster ride and the buy-and-hold strategy that any 5th grader could do without charging you a dime. Heck, I was on the phone with a new subscriber last month who told me his advisor lost almost 25% of his retirement account this year alone, and the advisor still charged him over $32,000 in management fees…
Im not trying to bash advisors. I know a lot of them, they are great, and many of them use my strategies for their clients, but a guy said this the other day, and it made me laugh.
“The two types of people who get paid for being wrong when you need their advice the most to be correct are weathermen and financial advisors.”
COMMENT FROM INDIVIDUAL INVESTOR I SPOKE WITH
Ok, I got off on a little tangent there, so, let’s get back to how only price pays!
If price movement is what pays us, then it’s only logical that we focus mainly on the price. Most indicators are based off of price, so they lag the last traded price for an investment. Some indicators, like the 50-day moving average, which many traders use, are actually lagging that investment by 50 days.
Don’t get me wrong; some lagging indicators work great for specific trading strategies. I like to keep an eye on the 5-, 20-, 50-, and 150-day simple moving averages. I only really like them when the investment has been trending for a long period of time, and the price sharply pulls back to one of those moving averages. Generally, you get a strong one to three-day bounce off of those moving averages the first time price touches them. But the point I am trying to make here is that if you want to be more of an active trader with weekly or monthly trades to generate a steady income or account growth, then you must focus on the things which have very little lag time and provide continuous trading opportunities.
Surprisingly, if you use a good combination of indicators, you can actually forecast short-term price movement before price moves. I show subscribers some of my intraday trade setups and investors my swing trade setups, and share the exact trades I’m trading in my accounts through my CGS Signals Newsletter.
I won’t lie. It is very easy to get caught up in using several indicators because there are hundreds, if not thousands, of them. Unfortunately, many are almost duplicates of the same data shown in a different format, and many will completely contradict what other indicators are showing. This leaves you confused and frustrated, and likely trading without a clearly defined strategy, and we all know how that ends.
The key to selecting the proper indicators and tools is to find what has been working best for a specific investment and the timeframe you are trading. Using indicators that represent different types of analysis (trends, cycles, volatility, volume, and market sentiment) so you do not have any overlap, you can then create a synergy of confirming indicators. They will increase your accuracy of a pending price movement in the near future to profit from.
A couple of interesting points you should know is that the stock market only trends 20-30 percent of the time. And according to J.M Hurst, the market oscillates (cycles) 20-30 percent of the time. What does this mean? It means that, at best, the market provides tradable price action for us to make money only 60 percent of the time. Why is this important? It tells you that even when the market is performing well, we will still be sitting on our hands and potentially in a cash position 40 percent of the time.
Investors who survive and thrive during bear markets understand the value and power of a cash position during specific market conditions. Sometimes, it is not about making money as an investor. Instead, it is more about preserving capital so that you can revest it later when there are safer opportunities available.
If you want to trade with the best odds possible, then you must have all the major bases covered in terms of analysis. Each indicator/tool that I use analyzes the market in a different way. So when several of my analysis tools are saying it’s time to enter or exit a position, then I know there is a high probability of a price movement, and I can take the proper course of action.
Knowing what data to follow and analyze is a major step in the right direction, but knowing what times of the day to pull that data for analyzing is equally important. You must follow the big money players, which means you should be analyzing and trading during times when they are active.
In a recent article How To Tell If The Stock Market Is Bullish Or Bearish, we covered some interesting points and chart you may want to review.
With some instruments, you can trade 24 hours around the clock. Many traders get caught up trading the futures or FOREX market, and that is not for beginners. Because these markets are still open during times when most individuals are home from work, they give individuals a way to place some trades and satisfy their urge to become a trader.
But what most individuals do not know is that overnight trading is one of the toughest times to trade. Because of the lighter volume and lack of liquidity, moves can be magnified in either direction. The big-money players who generate the majority of the volume and price stability during the day are out of the market.
Overnight and pre-market trading data should not be used in your analysis. For example, the S&P 500 futures contract can trade all night right into the regular trading hours. The opening bell is at 9:30 a.m. ET, and between 9:30 a.m.–9:40 a.m. (10 minutes), more contracts will be traded than what took place in the entire overnight and pre-market trading. I should also note that futures and FOREX are highly leveraged, so when you are wrong, your losses happen fast, and they are big. If you trade outside of regular trading hours, be aware of the added risks involved.
With this in mind, it is essential to focus on regular trading hours (9:30 a.m. ET–4:00 p.m. ET) when analyzing market data.
In short, if you are a trader or investor who thinks you need to follow the news and fundamental data, and read random opinions, good luck. While some of those trade ideas may work here and there, you will almost always give back any gains you made; if you don’t follow price and manage positions, it is just a matter of time. I have seen some traders learn this quickly within a year, and others I have come to me for mentoring after 30+ years of trying to do it themselves and just can’t seem to get the reliable results they want.
So, if you are unhappy with your trading or investing results or that of your advisor, maybe its time for you to revest your capital with a Consistent Growth Strategy. A strategy that exclusively holds assets rising in value, so you never again watch your wealth and retirement vanish right when you need it the most.
I have been helping individual investors and advisors safely navigate the financial markets since 2001. I live and breathe the markets with my efficient investing strategy using ETFs. For individual investors who struggle to keep up with the markets, my Consistent Growth Strategy can be AutoTraded in your self-directed retirement account, so you can spend time doing what you love. In contrast, your retirement accounts continue to grow and have risk management applied to preserve your capital during market corrections and multi-year bear markets.
Chris Vermeulen
Chief Investment Officer
www.TheTechnicalTraders.com
HOW TO TELL IF THE STOCK MARKET IS BULLISH OR BEARISH |
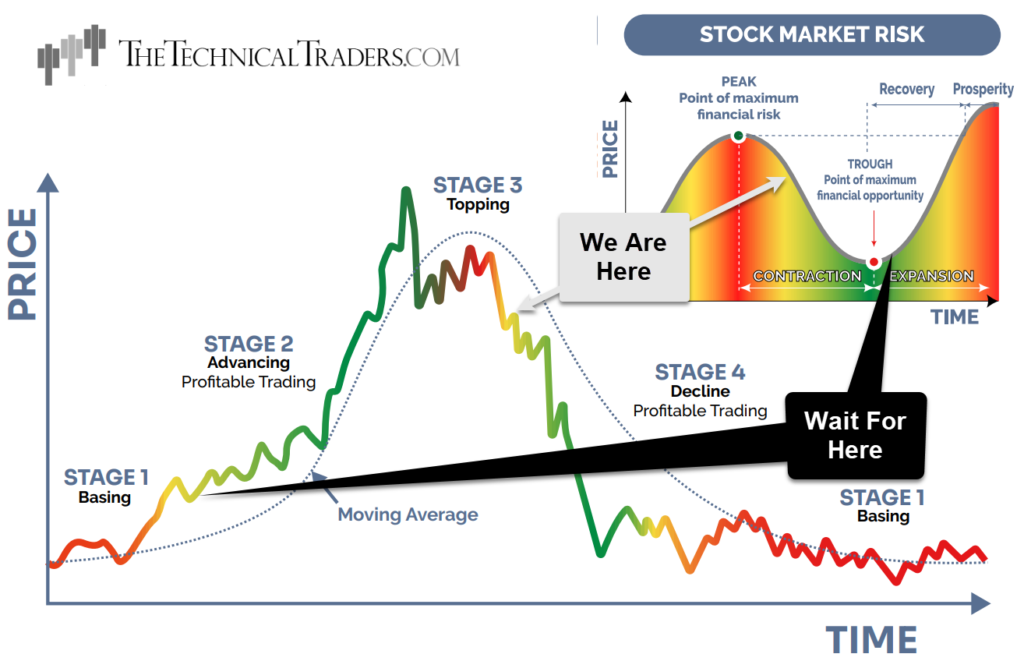
Astute market observers understand that the economic and stock market cycles are related but not the same. The stock market has a cycle that tends to lead or lag the economic cycle.
In the diagram below, you can see which sectors and commodities generally perform better or worst during different times within the stock and economic cycles.
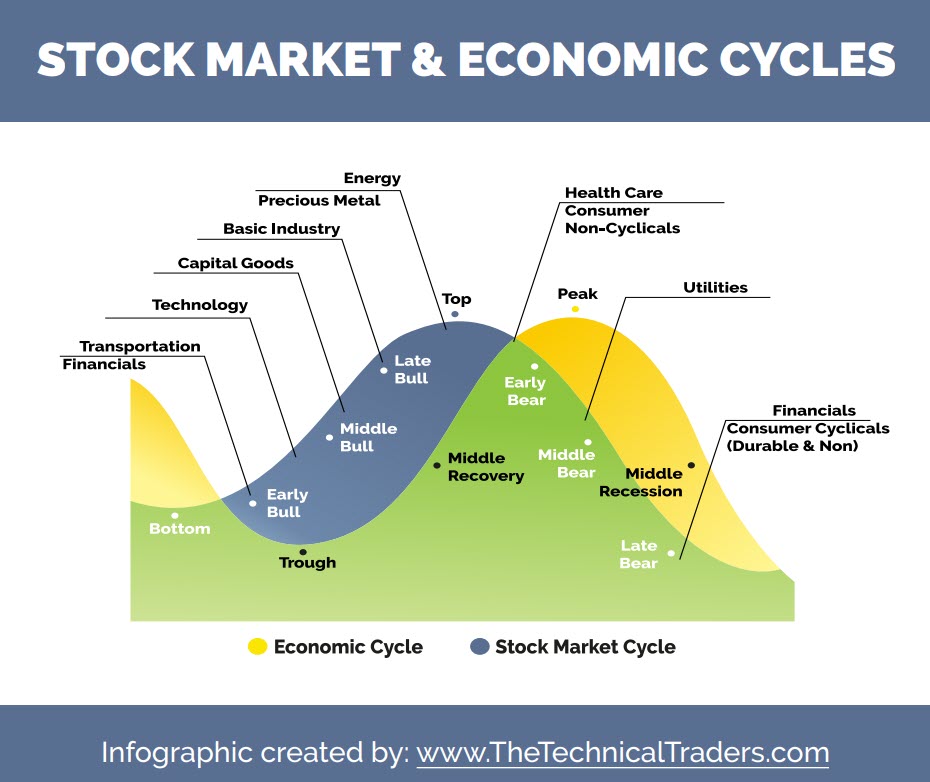
While the economy’s health is measured with lagging indicators, the stock market is forward-looking. Stock investors don’t focus on where the economy has been but on where they think it is going in the coming months. Economists read the latest economic reports of lagging data. Stock investors attempt to read the economic “tea leaves” for clues about future direction.
A strong economy is easy to identify. Corporate earnings are strong, growing businesses are expanding, and new ones are being created. Unemployment is low, even to the point where many job openings go unfilled for lack of qualified or willing candidates. Incomes are rising, and consumer spending is strong. Housing is robust, with lots of new construction starts and price appreciation. Energy and other commodity prices tend to be increasing due to strong demand.
In a strong economy, stocks have a bullish trend with occasional pullbacks within that trend. Every dip can be bought, and penalties for doing so are the exception rather than the rule. More speculative stocks tend to do well as investors try to place capital ahead of future growth industries, which is one of the trading strategies we focus on using the BAN – Best Asset Now newsletter.
Economic conditions eventually weaken for any number of reasons. It could be a speculative bubble that has just gone too far. It could be an overdue financial reckoning from the over-expansion of credit. Or perhaps a once-in-a-century pandemic that leads to a drastic slowdown in economic activity. We’ve seen all these conditions in recent decades.
Stocks tend to continue higher in a bull market even as leading indicators start to show weakness. Investors that step in to “buy the dip” are wrong with increasing frequency. Capital tends to rotate to more defensive sectors, and asset classes like the US dollar and commodities as cracks form in investors’ recency bias – thus, volatility increases. Eventually, the bull market inertia in stocks fades as it sinks in with investors that the economic indicators are deteriorating and likely to worsen. This is when stocks can appear both bullish or bearish day to day and sector by sector, confusing and frustrating investors.
If you want to learn more about how to see the markets clearer and to control your emotions, we put together a killer article to learn how your brain sees and perceives the markets and news.
A follower of our work said something along these lines about this article:
This is the wisest investment advice I have read out of the hundreds or thousands of newsletters I have read.
READ THIS ARTICLE
In a “typical” deteriorating economy, central banks like the Fed will step in at some point to stimulate the economy back to health by reducing the cost of capital with lower interest rates, also referred to as Quantitative Easing.
An optional part of this monetary policy is for the Fed to purchase distressed assets. In an extreme economic stumble, governments may step in with fiscal policy measures like direct stimulus and institutional bailouts. Eventually, the economy recovers. But there is also the risk of overstimulating the economy.
When the economy is running “too hot,” high demand is chasing too little supply. And that, of course, leads to inflation in the prices of goods and services. At some point, the Fed will step in by raising interest rates as part of a Quantitative Tightening program. A strong US dollar and higher Treasury yields go along with higher target rates from the Fed.
The strong Dollar makes US exports and commodities priced in USD more expensive for the rest of the world. That affects inflation in other countries and makes for greater challenges for their central banks. A strong US dollar also dampens US exports and the profits of multinational companies.
In this phase, there is the risk of central banks overshooting in their fight against inflation, but the good news is that we can take advantage of these shifts using ETFs and the CGS strategy.
Why is it so difficult to tell if a weak economy is bottoming out? Mixed signals. Some metrics are still declining, while others are improving.
When stocks have been bearish and are well off their highs, investors look for signs that they can put capital to work again in the stock market. This is another time when stock trends can flip and flop direction daily.
Sign up for my free trading newsletter, so you don’t miss the next opportunity!
Clear signs of an economic recovery include a peak in inflation data and more dovish language coming out of the Fed, suggesting that the pace of interest rate increases will slow or even reverse. Signs that inflation has peaked include:
By the time we see clear signals that an economic trough has bottomed, the stock market is likely already far out in front. Lingering bad news like disappointing earnings reports is more easily dismissed as investors focus on the outlook. Investors are anticipating a recovery that hasn’t fully formed yet, but they are ready to stick their toes back in the water.
When the signals are still mixed in a soft economy, investors again ask, “Is the stock market bullish or bearish?”. The surest answer in such a period of uncertainty is “Yes.”
Every day on Options Trading Signals, we do defined risk trades that protect us from black swan events 24/7. Many may think that is what stop losses are for. Well, remember the markets are only open about 1/3 of the hours in a day. Therefore, a stop loss only protects you for 1/3 of each day. Stocks can gap up or down. With options, you are always protected because we do defined risk in a spread. We cover with multiple legs, which are always on once you own.
If you are new to trading or have been trading stock but are interested in options, you can find more information at The Technical Traders – Options Trading Signals Service. Brian, who has been trading options for almost 20 years, sends out real live trade alerts on actual trades, such as TSLA and NVDA, with real money. Ready to subscribe, click here: TheTechnicalTraders.com.
Enjoy your day!
Brian Benson
Chief Options Strategist
TheTechnicalTraders.com
A VALUABLE LESSON IN KNOWING INVESTORS AND YOUR OWN PERSONALITY TYPE |
I recently shared my Myers-Briggs personality test publicly, and I did this for a couple of reasons.
For one, I enjoy sharing life experiences and who I am with the investors I work with. I believe in being open and honest with people and that I can learn something from everyone. Building a bond and trust with those who have similar passions and desires just feels good all around.
My goal is to help as many individuals as possible who believe what I believe and want to reach financial independence with new sources of income and grow their wealth with less effort and risk.
I grew up going to Zig Ziglar events. I was up on stage with him when I was only 12 years old, and Zig’s simple philosophy, which I believe in, is:
“You can have everything in life you want if you will just help enough other people get what they want.”
And two, if you understand how people’s brains work and how they think and react, including your own personality, you have a huge edge when it comes to trading and investing, which is what I will show you in this article.
Well, I think you should know your personality type. But before you do the test to figure out “thyself,” finish reading what I must share here as it ties directly into your investing success.
There are 16 personality types, and the ones with the highest distribution are:
ISFJ
ESFJ
ISTJ
ISFP
ESTJ
ISTP
ESTP
ESFP
A common thread among these top personality types is the “S,” which stands for Sensing vs. “N,” for Intuition.
When it comes to trading and investing, Earl Nightingale’s quote could not be more accurate:
“If you don’t have a good model for success, just look at what everybody else is doing and do the opposite.”
As we know, the majority of traders lose money. A study showed after tracking 10,000 trading accounts for a year that more than half of the accounts LOST money during a one-year bull market rally. I believe emotions are the culprit.
Sensing focuses on what you can detect with your five senses.
Intuition focuses on the impressions and patterns gathered from information. (data, technical analysis, chart patterns, statistics, logic, etc.)
Statistics show that 73.3% of individuals are “Sensing,” and if you know anything about the financial markets and how they move, it’s all based on people’s emotional reactions. News and opinions get into investors’ minds and trigger emotional trading and investing actions.
Why do people trade on emotions and get sucked into news and opinions? Because stories sell ideas and, if told well, can trigger the senses in our brain to see, feel, smell, and even taste the things being explained in a detailed story/news clip. The “sensing” personalities tend to follow stories that should be ignored, which I consider news to be useless noise.
Now, let’s take things another step further. The second most common personality trait is “Feeling” at 59.8%, which falls under the pair Thinking or Feeling category and also plays a role in our success as investors.
This pair describes how you make decisions.
Thinking focuses on objective principles and impersonal facts.
Feeling focuses on personal concerns and the people involved.
If you have an “F” in your personality type, you must be aware that you will likely be more emotional as an investor, which can also lead to poor timing for your investment decisions.
Warning: If you have an “S” and “F” in your results, I believe it is vital that you embrace knowing who you are and take action to create a plan, steps, and rules to follow when trading and investing. It’s much easier for you to get sucked into news, opinions, stories, hype, and have constant FOMO because it is just how your brain works.
Being a Sensing and/or Feeling person are wonderful traits, heck I wish I had more of them because I’m the polar opposite. I’m more like the actor Data on Star Trek. Also, I should be clear that none of this has to do with your IQ or experience. This personality test tells us how our brains are equipped to handle long-term thinking and/or seeing the big picture.
Now, I bet you are excited or maybe even nervous to know what your personality type is… But hold on for just a few more minutes!
I am one of the rarest personality types, the INTJ. Also known as “The Scientist” or “The Architect.” I’m the opposite of a touchy-feely person. With that said, my personality is highly romantic, but we won’t go there…
What I am trying to say here is that we could be a match made in heaven.
Why? Because I ignore all the noise, stories, lies, and BS the market dishes out on a daily basis. I process the data and find logical, high-quality trade and investment opportunities that put the odds in favor of reliably making money trading stocks, bonds, commodities, and currencies.
In general, successful people are future-oriented and create goals and visions of where they WILL be someday. They think outside the box and dance to the beat of their drum. These individuals are driven and follow their natural skills and passions, which for me, happen to be stock market analysis and investing.
I deal with a lot of emotional people in my line of work. The good, the bad, and the ugly, but I understand what most are going through. Making or losing money and listening to strong news stories spark emotions, and they always will, it comes with the territory.
Based on helping individual traders and investors since 1997, I have a pretty good feel from talking with them or reading their emails if they are an “S,” “F,” or possibly both. People who tend to cancel their trade alert subscription with me (rare, but it happens) probably have one of those two characteristics.
Why do they cancel? Generally, they struggle to think for themselves to find and manage trades and their emotions.
They don’t see the boring logic behind my research, they lack the patience to wait for lower-risk opportunities, and they make rash/emotional decisions instead of examining how those decisions will affect them in the long run. Things like trading around news/hype, always wanting to buy just one stock or sector, or holding on to losing trades because they can’t man-up, take a loss, and move on to better and brighter things.
For example, a classic Sensing/Feeling newsletter cancellation email reads something like:
“Hi Chris,
Thanks for all the education you have provided; it has been really useful. However, I need to cancel my subscription.
It’s not your trades. It’s just I ended up being the bag holder on a number of MY positions. Now my strategy is just to wait for a few years. It is not worth closing the trades at these prices, plus I believe in most of my positions ;)”
Another email,
“Chris, I love your newsletter and have learned a lot. However, there are not enough trades, and I feel that we should be making lots of money from these big daily price swings in the market. I’m worried about what the Fed will do, and with the war and other scary news, I don’t know what to do, but I don’t have time to wait for your slower trade signals. So please cancel my subscription.”
It’s this sort of thinking and email that triggers my eyes to roll to the back of my head and grumble because it makes absolutely no sense to me. I’m an “Intuitive Thinker” who logically filters out noise, has strategies in place, and who only wants to bet on the markets when the odds are clearly in favor of making money, and I ignore the rest.
But, let me be clear about one thing, some of the best traders in my newsletter who have been with me for years are very Sensing and Feeling people.
What makes them different is that they know they need rules, systems, and guidance to navigate the market safely. They lean on me for that and are very appreciative of it. I won’t lie. It feels nice to be praised for my work by these individuals. They have a way of wearing their heart on their sleeve.
If you want to turn your trading and investing accounts around and watch your account grow, you need to make a change. I can provide you with everything you need, from ETF trading signals from my Consistent Growth Strategy to owning the hottest sectors during stock market rallies. I even provide autotrading, so if you don’t know anything about the markets or don’t have the time to learn or follow the trade signals, you can have them traded for you in your brokerage account at no additional cost from me. Learn More…
Recently I asked subscribers to tell me what I helped provide them with, overcome, figure out, learn, avoid, and master. These are the top things they said represented in a word cloud because it takes hundreds of comments and testimonials and turns them into bite-size data for you none intuitive thinkers.

I will now hand the reins over to you. Take this quick test, figure out how your brain works, read your complete personality profile, and let it sink in. Be proud of who you are and what makes you unique.
It does not matter which personality you are; we can all reach financial success together. As Oprah Winfrey said, “no one ever reaches success on their own. They always have help,” so I am here to help you.
Myers–Briggs Type Indicator (MBTI) is an introspective questionnaire that tells individuals their preferences in how they communicate, interact with others, perceive the world, and make decisions.
The test assigns a value to each of four categories: introversion or extraversion, Sensing or Intuition, thinking or feeling, and judging or perceiving. One letter from each category is used to generate a four-letter result which is your personality type, such as “INTJ” or “ESFP.”
Free Test: https://www.16personalities.com
If you enjoyed this article, please share it with others, and be sure to join my free newsletter and have more articles like this delivered to your inbox.
Chris Vermeulen
Chief Investment Officer
www.TheTechnicalTraders.com
REAL ESTATE: PREPARE FOR MASSIVE WEALTH CREATION IN 2023 |
Entrepreneurs and investors should prepare for one of the most significant wealth-creation opportunities of their lifetime in 2023. It will be similar to the COVID housing bubble in terms of watching your home value rise quarter after quarter, but this time it will be sustainable and carry you into retirement with more than enough cash flow to live your retirement like a billionaire.
Real estate is one of the most significant investments we make as individuals. A home is one of the best assets anyone can have, but there will be times when real estate will lose value, which we’ve recently started to see happen. Conversely, there will also be tough times when real estate can increase in value by leaps and bounds, which we experienced in 2021 through to February 2022 when housing prices topped out.
I recently had a basement apartment built in one of my rental properties. And boy, was that a mistake. I was quoted $35K, and it ended up costing $100+K, and it is still not completed. The labor rates and quality of labor these days are piss poor. Everyone is gouging and overcharging, and no one completes their jobs. They all seem to leave the last 10% of the job, the final finishing portions (the most important part and where quality skills come into play), and vanish to move on to the next easy job for quick money.
I’m bitter about my build, I got taken to the cleaners, and it is going to take years to recoup that extra expense. If you are an investor or entrepreneur, then you understand the pain of a $65+K hit because money does not grow on trees, and we know the hours, stress, creativity, and grit required to make that money.
Karma has a way of coming back to those who do wrong. The pending housing and building collapse, I expect in the near future, will be a breath of fresh air for savvy investors and entrepreneurs who can preserve their capital during the stock, bond, and real estate correction over the next 12-36 months.
You see, in my small town, there is only a small group of truly skilled home builders and reno/repair people. Everyone I know has had terrible building experiences since COVID. It seems everyone stopped working for free money, or they picked up a hammer, called themselves a builder, and started charging $45-75 per hour without knowing what they were doing and inflating material costs.
You can’t have good times without tough times, and with mortgage rates more than doubling in a year and leading expert Christopher Whalen saying we should brace for 10% mortgage rates, the housing market and builders are going to be in for a rude awakening.
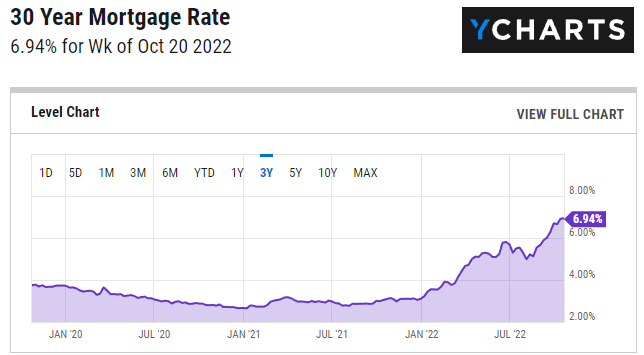
When mortgage rates rise, home prices fall, similar to the bond market. As the Fed raises rates, bond prices come tumbling down.
Since the Fed started to raise rates, the price of bonds has fallen over 47%, wiping out over a decade of investor growth. I feel the same is about to happen to the housing market, but the only difference is that the real estate cycle moves much slower and lags behind the stock market and recession by 1-3 years.
While most homeowners in the USA are lucky as they locked in a 30-year rate to keep costs low, the real issue and driver of falling home prices is the fact that most Americans live paycheck to paycheck and are overleveraged. With layoffs already starting to show up by large companies every week, and labor rates topping out, it is just a matter of time before tens of millions get pay cuts and laid off, and then they cannot afford their homes and be forced to sell and rent. This will drive house prices lower, but it’s going to make time to mature.
In addition, new homeowners trying to pick up these houses will be forced to pay 10+% mortgage rates and thus demand a lower home price to make it feasible to own or rent as an investment property.
Home building will come to a screeching halt, and the faux tradesmen who have burned every bridge with all their one-time customers will be left scrambling and jobless.
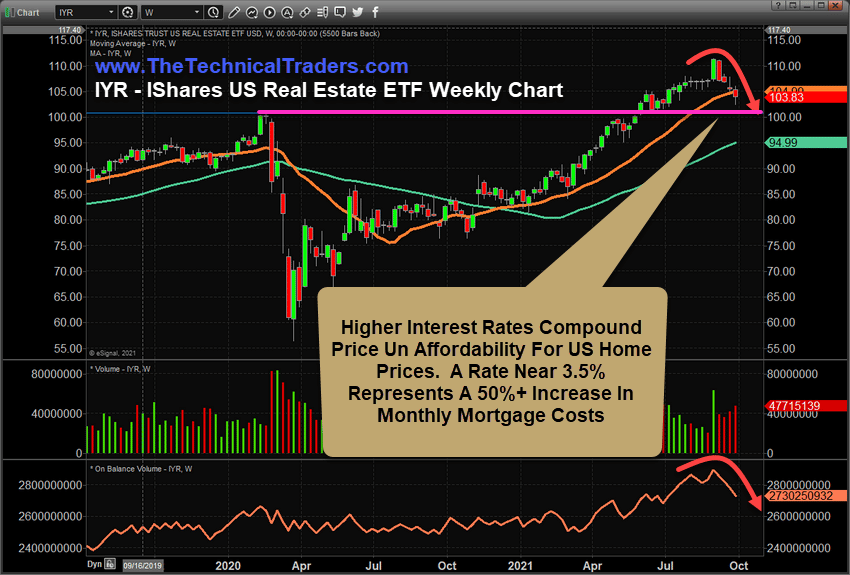
Savvy real estate investors stopped buying a long time ago, which we can see from this chart I posted in my last real estate article.
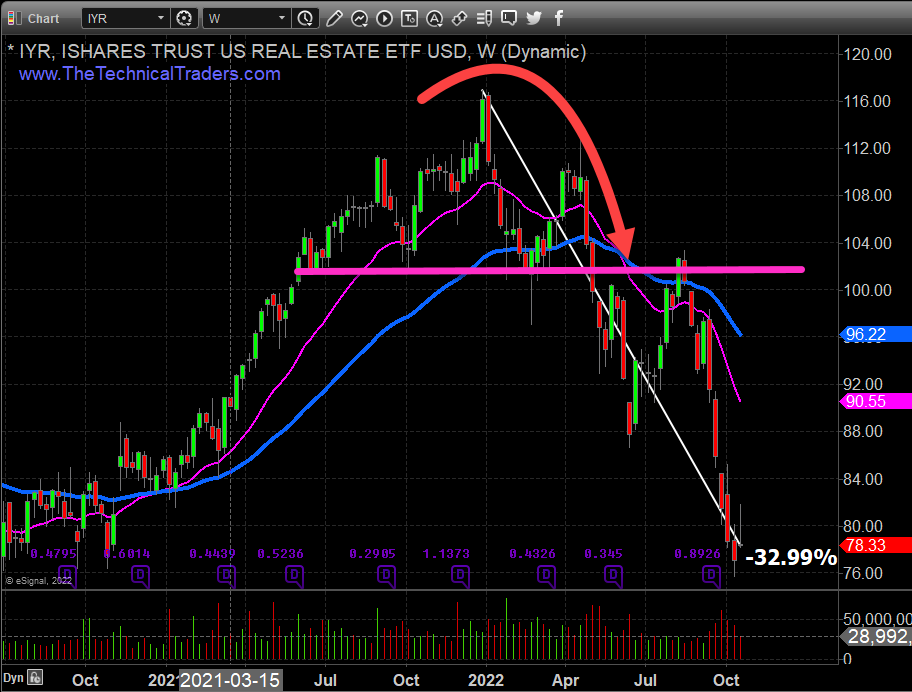
This updated chart shows how the price broke down from our 2021 support level and continues to fall. This ETF allows us to see what the most active real estate investors are doing with their money.
It seems they are raising cash, just as we have been doing at TheTechnicalTraders, to avoid the “bear market blues” of falling stocks, bonds, and real estate.
If you have followed me, then you know technical analysis is my thing. I don’t care about economic data, politics, news, or fundamentals. All that matters for us as investors is that we own assets rising in value, which is exactly what I specialize in doing with my CGS ETF Portfolio.
Imagine if you see the trends of assets and know immediately if you should own it or ditch it. Do you think you could avoid market corrections and bear markets? Do you think you could profit from rising and falling prices?
See my Nasdaq 100 (QQQ) daily chart below for a visual.
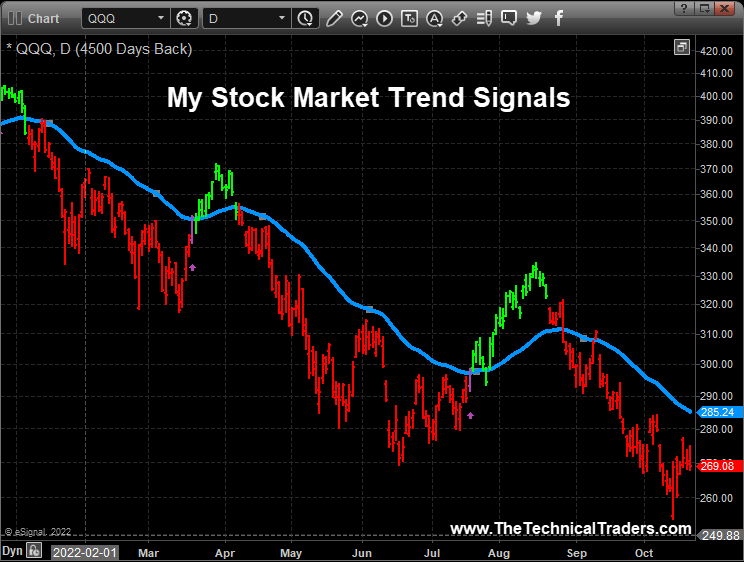
In short, I don’t want us to go through this pending recession and financial reset. It is not going to be fun, but it will create an opportunity to buy assets at or below their fair value, which is a massive opportunity for anyone cash-rich waiting like a lion to pounce when the timing is right.
For example, I bought and built my dream home on the water during tough times, and I remember our builder and architect telling us how lucky we were to be building then and how cheap everything was.
I also bought other properties and built high-end rental homes. I now have over 75 tenants for great monthly cash flow. I plan to double my real estate investments in due time because it’s cash for life if you do it correctly and don’t overpay or get over-leveraged.
I could start buying in the next 12 months or in three years. Not sure. We just need to wait and let the market dictate when to take action. I use technical analysis and follow price trends which makes it simple to know when something is rising or falling in value, and if you know me at all, then you know I only buy investments rising and ditch stocks and bonds falling in value.
Another story, in 2009, I bought a Canadian utility ETF that paid me a 16% dividend, and the price of the fund rallied over 100% within a couple of years. I no longer own it, but these types of opportunities are everywhere when the masses are suffering and forced to sell everything they own. The good news is you can also own the best stocks during the next market rally.
Follow me to success and ride my coattails over the next few years as we embark on this wild, thrilling, and lucrative investment adventure!
If you enjoyed this article, please share it with others, and be sure to join my free newsletter and have more articles like this delivered to your inbox.
Chris Vermeulen
Chief Investment Strategist
www.TheTechnicalTraders.com